

Census of India: Definitive Importance, 2011 Data, and Key Insights

What is Census?
Census is a counting of people in a country.
It is a very big survey done by the Government to find out how many people live in the country and how they live.
You can think of it like taking attendance in a classroom.
In school, the teacher counts how many students are present.
Similarly, in a census, the government counts how many people live in India.
Who conducts the Census in India?
In India, the Office of the Registrar General and Census Commissioner conducts the census. Census in India is done every 10 years.
This department works under the Ministry of Home Affairs (MHA).
Importance of Census
The Census of India is the most detailed and trusted source of information about the people of the country. It gives clear knowledge about the population, their social background, and their economic condition. The Census takes place once every ten years and it helps us understand how the population is changing, where people live, and how fast the population is growing.
This information is very important for the government because it helps in making good plans for the future. It guides the government in making policies, improving governance, and sharing resources fairly among all states and Union Territories. The data collected in the Census supports development work and helps leaders understand the real needs of the people.
Census data is pivotal for both government and academic purposes:
- Policy Formulation: Population data helps the government make strong and useful plans. It supports the creation of welfare schemes, health programs, and education policies that truly reach the people. When the population figures are correct, the planning becomes more effective and the benefits can be given to the right groups.
- Electoral Planning: Census information is very important for deciding how voting areas should be formed. It helps in fixing the boundaries of constituencies and guides the government in deciding how many seats each state should get in the Parliament and in the state assemblies. This process ensures fair representation for all regions.
- Infrastructure Development: The government uses information about population density and demographic changes to make development plans. With the help of this data, the government can build new roads, open more schools, set up hospitals, and create better facilities in towns and cities. Census information makes development work more accurate and balanced.
- Research and Academia: Students, teachers, scholars, and research institutions use census data for many kinds of studies. They depend on this information to understand social issues, economic conditions, and environmental changes. This data helps them make correct reports and conduct meaningful research.
- Government Exams and UPSC: Census data is very important for students who prepare for government exams. Questions related to population numbers, literacy rates, sex ratio, and state wise statistics are commonly asked. A clear understanding of census information helps aspirants score better and strengthens their preparation for civil services.
The Census of India does not only show how the population of the country looks today, but it also keeps a clear record of how India has grown and changed over the years. It acts like a detailed history of our people and our progress. This makes the census a very important tool for planning, understanding future needs, and making strong decisions for the development of the nation.
Census of India – 2011 Data
The Census of India in the year 2011 was the fifteenth national census carried out by the Government of India. This census gave a clear and detailed picture of the country’s population and many important demographic facts. It also shared useful information about social and economic conditions in different regions. The data collected in this census became an important guide for government planning, public policies, and different kinds of research work.
Some important points from the Census of India in the year 2011 are given below.
Total Population:
India recorded a population of 1,210,854,977 people. This showed a population growth of 17.7 percent when compared with the population counted in the Census of 2001. This increase helped the government understand how fast the country was growing during that time.
Population Distribution:
The share of people living in towns and cities reached 31.16 percent. This rise showed that more people were moving from villages to urban areas in search of work, education, and better facilities. It also showed a clear trend of growing urban life in India.
States with Highest Population:
Uttar Pradesh continued to have the largest population in the country. After Uttar Pradesh, the next two states with the highest population were Maharashtra and Bihar. These states remained important for planning and development because of their large number of people.
Literacy and Sex Ratio:
The literacy rate of the country improved to 74.04 percent. This increase showed that more people were getting access to education. The sex ratio reached 940 females for every 1000 males. This improvement showed slow but steady social progress in different parts of India.
The Census of 2011 also collected information about languages spoken by people, different caste groups, work and employment patterns, and movement of people from one place to another. All this information made the census a very important source for government planning, development work, and academic studies.
This census is still an important reference for UPSC and other government exams. Many questions in these exams are taken from state wise statistics, population growth, and different social and economic indicators that are included in this dataset.
Facts about India’s Census 2011
| Total Population | 1,210,854,977 (1.21 billion) |
| Male Population | 623,724,248 (51.54%) |
| Female Population | 586,469,174 (48.46%) |
| Population Density | 382 persons per sq. km |
| Sex Ratio | 940 females per 1,000 males |
| Child Sex Ratio (0-6 yrs) | 919 females per 1,000 males |
| Literacy Rate | 74.04% (Male: 82.14%, Female: 65.46%) |
| Urban Population | 377.1 million (31.16%) |
| Rural Population | 833.1 million (68.84%) |
| Decadal Growth Rate | 17.64% (2001–2011) |
| Child Population (0-6 yrs) | 13.12% of total population |
| Most Populous State | Uttar Pradesh (199.5 million) |
| Least Populous State | Sikkim (610,577) |
| Highest Literacy Rate | Kerala (93.91%) |
| Lowest Literacy Rate | Bihar (63.82%) |
| Highest Sex Ratio | Kerala (1,084 females per 1,000 males) |
| Lowest Sex Ratio | Haryana (877 females per 1,000 males) |
| Highest Population Density | Bihar (1,106 persons per sq. km) |
| Lowest Population Density | Arunachal Pradesh (17 persons per sq. km) |
Population of India as Recorded in the 2011 Census
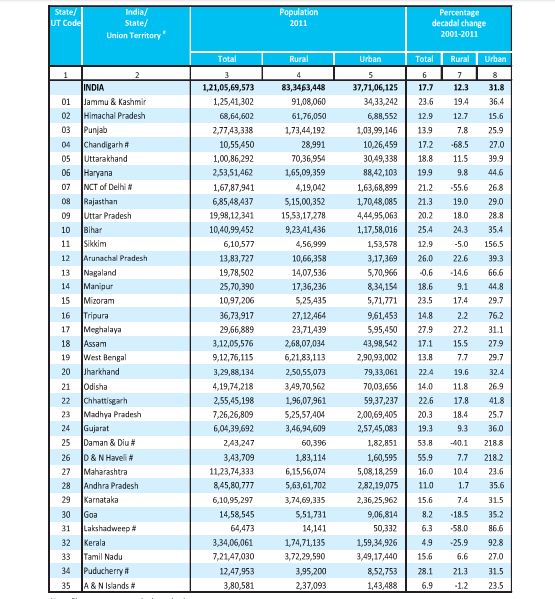
The Census of India in the year 2011 reported that the total population of the country was 1,210,854,977. This number showed a large increase when compared with the population counted in the Census of 2001. The population was not the same in all states. Different states showed different levels of population density, different levels of people living in towns and cities, and different rates of growth.
Some states had very crowded areas, while others had more open land and fewer people. In the same way, some states showed fast urban growth, while others continued to have mostly rural populations. These differences helped the government understand how each state was developing.
The table below gives the total population of every state in India as recorded in the Census of 2011. This information helps students, researchers, and policy makers study population patterns in a clear and organized way.
Population Density
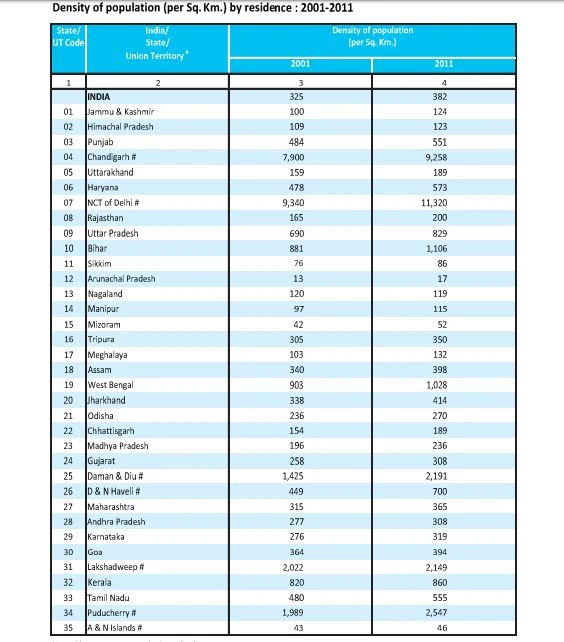
Population density refers to the number of people living per square kilometer in a given area. The 2011 Census of India shows significant variation across states, reflecting differences in geography, urbanization, and population distribution. Higher density indicates more crowded regions, while lower density often corresponds to hilly or remote areas.
Sex Ratio
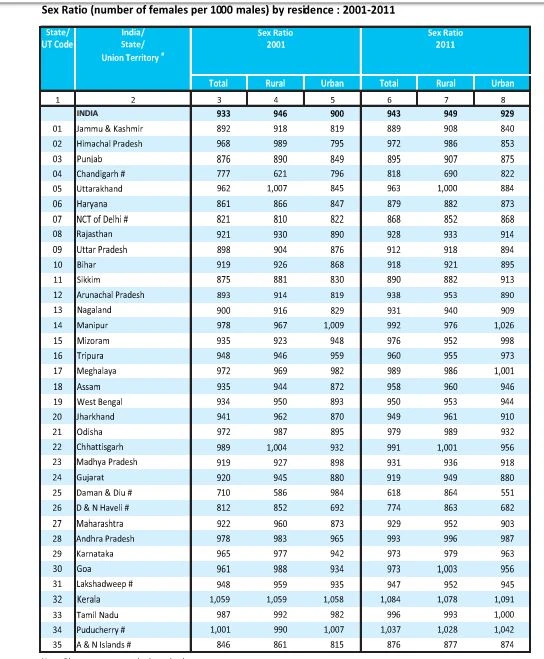
The sex ratio is the number of females per 1,000 males in a population. The 2011 Census of India shows improvements in the overall sex ratio compared to 2001, though variations exist across different states and Union Territories. Monitoring sex ratio helps in understanding gender balance and planning social welfare initiatives.
Literacy Rate
The literacy rate indicates the percentage of people aged seven and above who can read and write with understanding. According to the 2011 Census, India’s overall literacy rate increased to 74.04%, with significant variation across states and Union Territories. Male literacy remains higher than female literacy in most regions, highlighting the need for focused educational initiatives for women.
| State/UT | Overall Literacy Rate (%) | Male Literacy (%) | Female Literacy (%) |
| Kerala | 93.91 | 96.02 | 92.07 |
| Mizoram | 91.33 | 92.65 | 90.04 |
| Tripura | 87.75 | 92.18 | 83.14 |
| Maharashtra | 82.34 | 88.38 | 75.87 |
| Goa | 88.70 | 92.86 | 84.66 |
| Tamil Nadu | 80.33 | 86.77 | 73.86 |
| Gujarat | 78.03 | 85.75 | 69.68 |
| West Bengal | 77.08 | 82.67 | 71.16 |
| Karnataka | 75.36 | 82.85 | 67.94 |
| Andhra Pradesh | 67.02 | 74.88 | 59.15 |
| Odisha | 72.87 | 81.59 | 64.01 |
| Punjab | 75.84 | 80.44 | 70.73 |
| Haryana | 75.55 | 84.06 | 65.94 |
| Madhya Pradesh | 69.32 | 78.73 | 59.24 |
| Uttar Pradesh | 67.68 | 77.28 | 57.18 |
| Bihar | 63.82 | 73.39 | 53.33 |
| Jharkhand | 66.41 | 76.84 | 55.42 |
| Assam | 72.19 | 75.89 | 68.55 |
| Himachal Pradesh | 82.80 | 89.53 | 75.93 |
| Uttarakhand | 78.82 | 87.40 | 70.01 |
| Jammu & Kashmir | 68.74 | 78.26 | 58.01 |
| Sikkim | 81.42 | 86.58 | 75.61 |
| Andaman & Nicobar Islands | 86.27 | 90.75 | 81.88 |
| Chandigarh | 86.43 | 90.81 | 81.93 |
| Dadra & Nagar Haveli | 76.24 | 83.16 | 68.97 |
| Daman & Diu | 87.07 | 89.95 | 83.82 |
| Lakshadweep | 92.28 | 96.11 | 88.33 |
| Puducherry | 85.85 | 90.78 | 80.98 |
UPSC Related Questions – Census of India 2011
| Question | Answer |
|---|---|
| What was the total population of India as per the 2011 Census? | 1,210,854,977 |
| Which state had the highest population in 2011? | Uttar Pradesh (199.58 million) |
| Which state had the lowest population in 2011? | Sikkim (610,577) |
| What was the population growth rate during 2001–2011? | 17.64% |
| What was the total urban population in 2011? | 377.1 million (31.16%) |
| What was the total rural population in 2011? | 833.1 million (68.84%) |
| Which state had the highest population density? | Bihar (1,106 persons/sq. km) |
| Which state had the lowest population density? | Arunachal Pradesh (17 persons/sq. km) |
| What was the overall literacy rate in 2011? | 74.04% |
| Which state had the highest literacy rate? | Kerala (93.91%) |
| Which state had the lowest literacy rate? | Bihar (63.82%) |
| What was the overall sex ratio in India in 2011? | 940 females per 1,000 males |
| Which state had the highest sex ratio? | Kerala (1,084 females per 1,000 males) |
| Which state had the lowest sex ratio? | Haryana (877 females per 1,000 males) |
| What percentage of India’s population were children (0–6 years) in 2011? | 13.12% |
| Which state had the highest child population (0–6 years)? | Uttar Pradesh |
| Which state had the lowest child population (0–6 years)? | Sikkim |
| What was the male literacy rate in India in 2011? | 82.14% |
| What was the female literacy rate in India in 2011? | 65.46% |
| Which Union Territory had the highest literacy rate? | Lakshadweep (92.28%) |
| Which Union Territory had the lowest literacy rate? | Dadra & Nagar Haveli (76.24%) |
| Which state recorded the highest urban population? | Maharashtra |
| Which state recorded the lowest urban population? | Arunachal Pradesh |
| What was the population of Delhi in 2011? | 16,787,941 |
| Which state had the maximum increase in population between 2001 and 2011? | Uttar Pradesh |
| Which state had the minimum increase in population between 2001 and 2011? | Sikkim |
| What was the literacy rate of Himachal Pradesh in 2011? | 82.80% |
| Which state had the highest female literacy rate? | Kerala |
| Which state had the lowest female literacy rate? | Bihar |
| How many states and Union Territories were covered in the 2011 Census? | 29 states and 7 UTs |
Frequently Asked Questions on Census of India 2011
1. What is the Census of India?
The Census of India is a nationwide exercise conducted every 10 years to collect demographic, social, and economic data of the population.
2. When was the 2011 Census conducted?
The Census of India 2011 was conducted in two phases: House Listing (April–September 2010) and Population Enumeration (9–28 February 2011).
3. Who conducts the Census in India?
The Office of the Registrar General & Census Commissioner of India, under the Ministry of Home Affairs, is responsible for conducting the Census.
4. How often is the Census conducted in India?
The Census is conducted every 10 years. The last completed Census before 2011 was in 2001.
5. What was the total population of India in 2011?
The total population recorded was 1,210,854,977.
6. Which state had the highest population according to the 2011 Census?
Uttar Pradesh was the most populous state with 199.58 million people.
7. Which state had the lowest population in 2011?
Sikkim had the lowest population, totaling 610,577.
8. What was India’s overall literacy rate in 2011?
The literacy rate increased to 74.04%, with male literacy at 82.14% and female literacy at 65.46%.
9. What was the overall sex ratio in India in 2011?
The sex ratio was 940 females per 1,000 males.
10. Which state had the highest literacy rate?
Kerala, with a literacy rate of 93.91%, had the highest literacy among all states.
11. Which state had the lowest literacy rate?
Bihar had the lowest literacy rate at 63.82%.
12. How is census data used for governance?
Census data helps in policy formulation, resource allocation, urban planning, electoral delimitation, and socio-economic research.
13. What is the population density of India as per 2011 Census?
The national average was 382 persons per square kilometer, with variations across states.
14. What percentage of India’s population lives in urban areas according to the 2011 Census?
Approximately 31.16% of India’s population lived in urban areas.
15. Why is the Census important for UPSC and other government exams?
Census data provides essential facts and statistics on population, literacy, sex ratio, and density, frequently asked in exams like UPSC, SSC, and State PSCs.